When Lucas George Wendt arrived in Lajeado in late May, the water had already begun to recede.
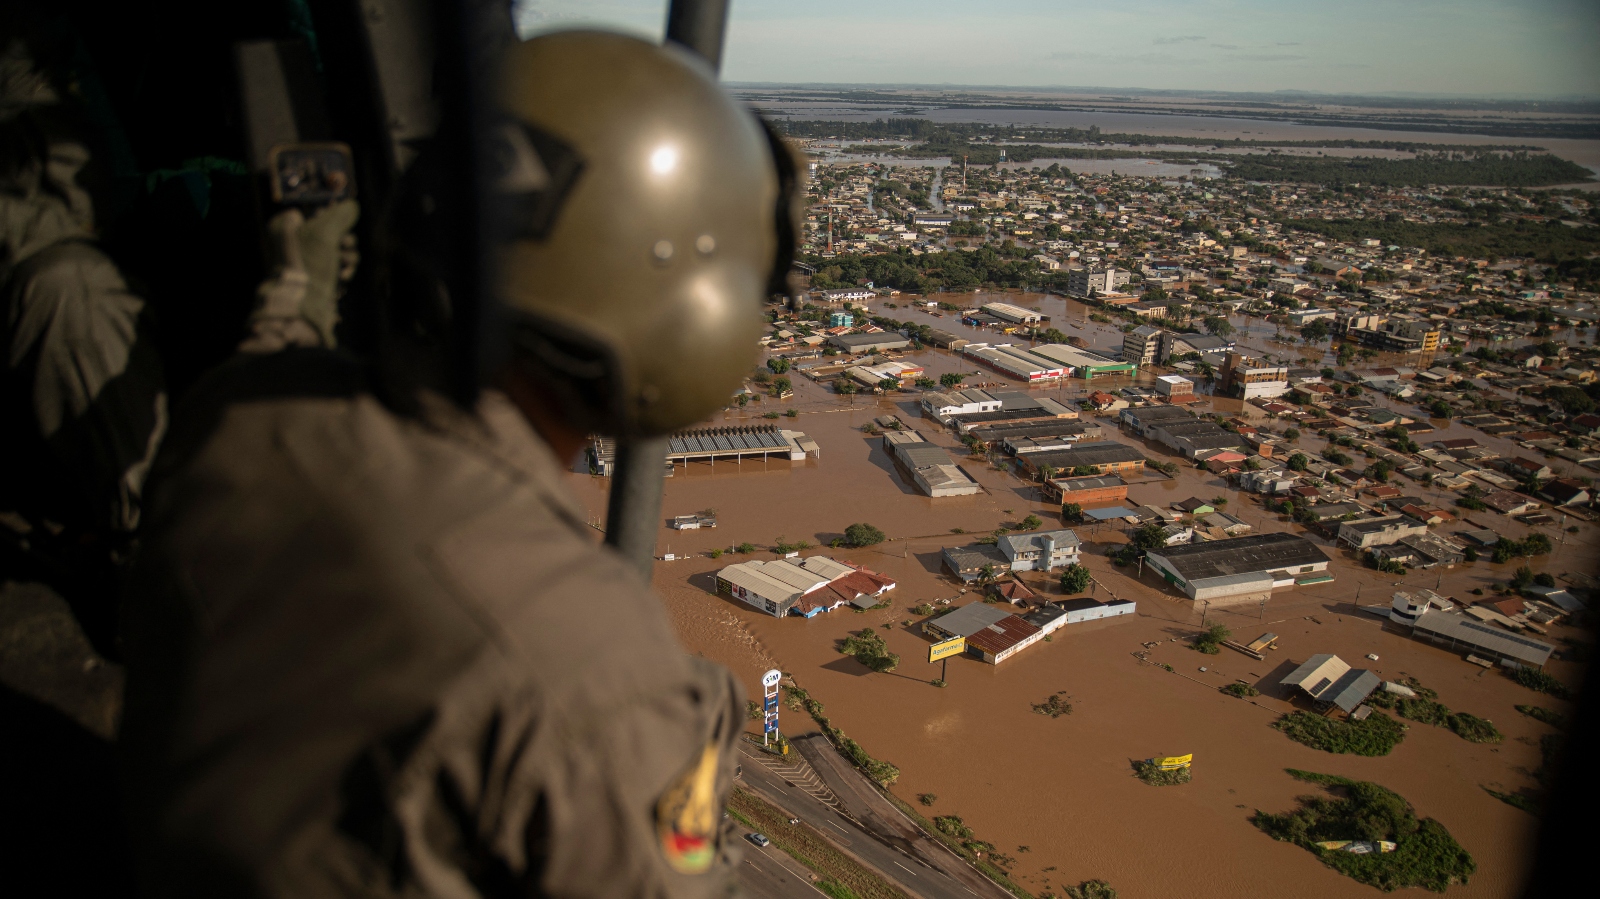
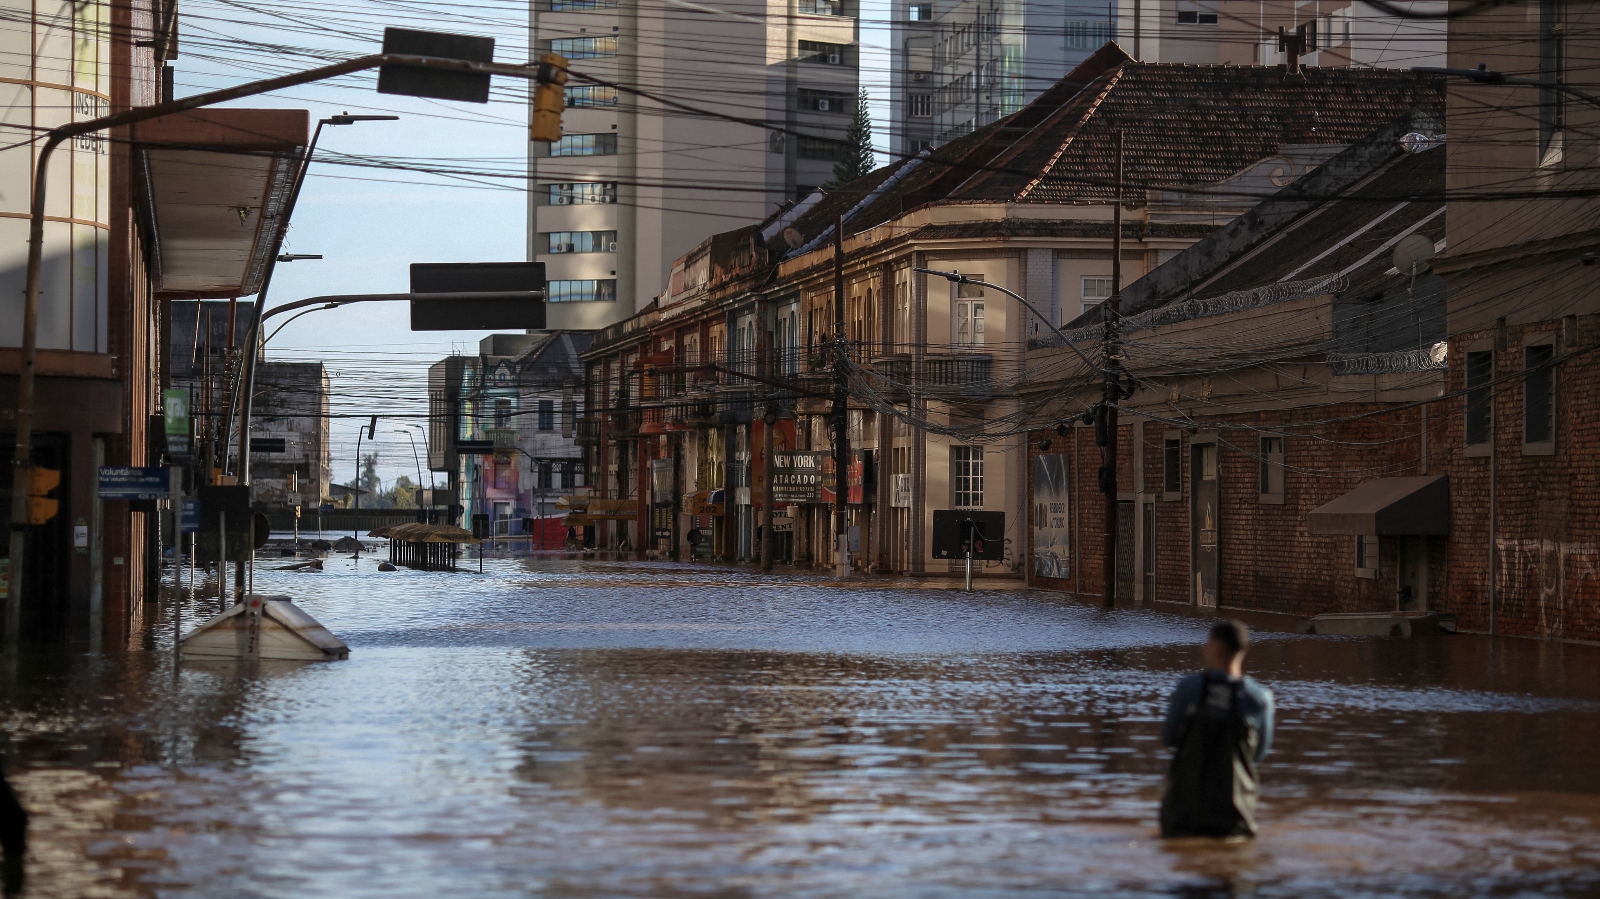
Just days before, the peaks of roofs and the tops of trees were some of the only things visible above the murky brown water that covered his hometown. Located in the Taquari Valley, Lajeado, population 85,000, was one of the communities worst hit by the historic floods that tore through Brazil’s southernmost state, Rio Grande do Sul, between late April and mid-May, displaced more than 650,000 people and killed 173. , and 806 injured.
When Wendt arrived, 38 people were still missing. Backhoes cleared mud from blocked roads, city workers were cleaning sidewalks with pressure washers, and volunteers were sorting through donations of clothing, food, personal hygiene products and bottled water.
Wendt – who now lives in the state capital Porto Alegre and is studying for his master’s degree in information science while working in communications at the University of Taquari Valley (Univates) – came home to check in with family and friends. But he also wanted to do something to help while he was there.
Last September, he heard about a Univates mapping project led by researcher Sofia Royer Moraes, an environmental engineer studying extreme flooding in the Taquari-Antas river basin. At the time, the Taquari River, which runs through Lajeado, overflowed, leaving the region to deal with the worst flooding in 82 years, displacing at least 359,000 people and killing 48. Residents of the Taquari Valley were used. deal with annual flooding, but this event was different. Studies showed that climate change worsened the flood, which meant that future floods would bring even more deaths.
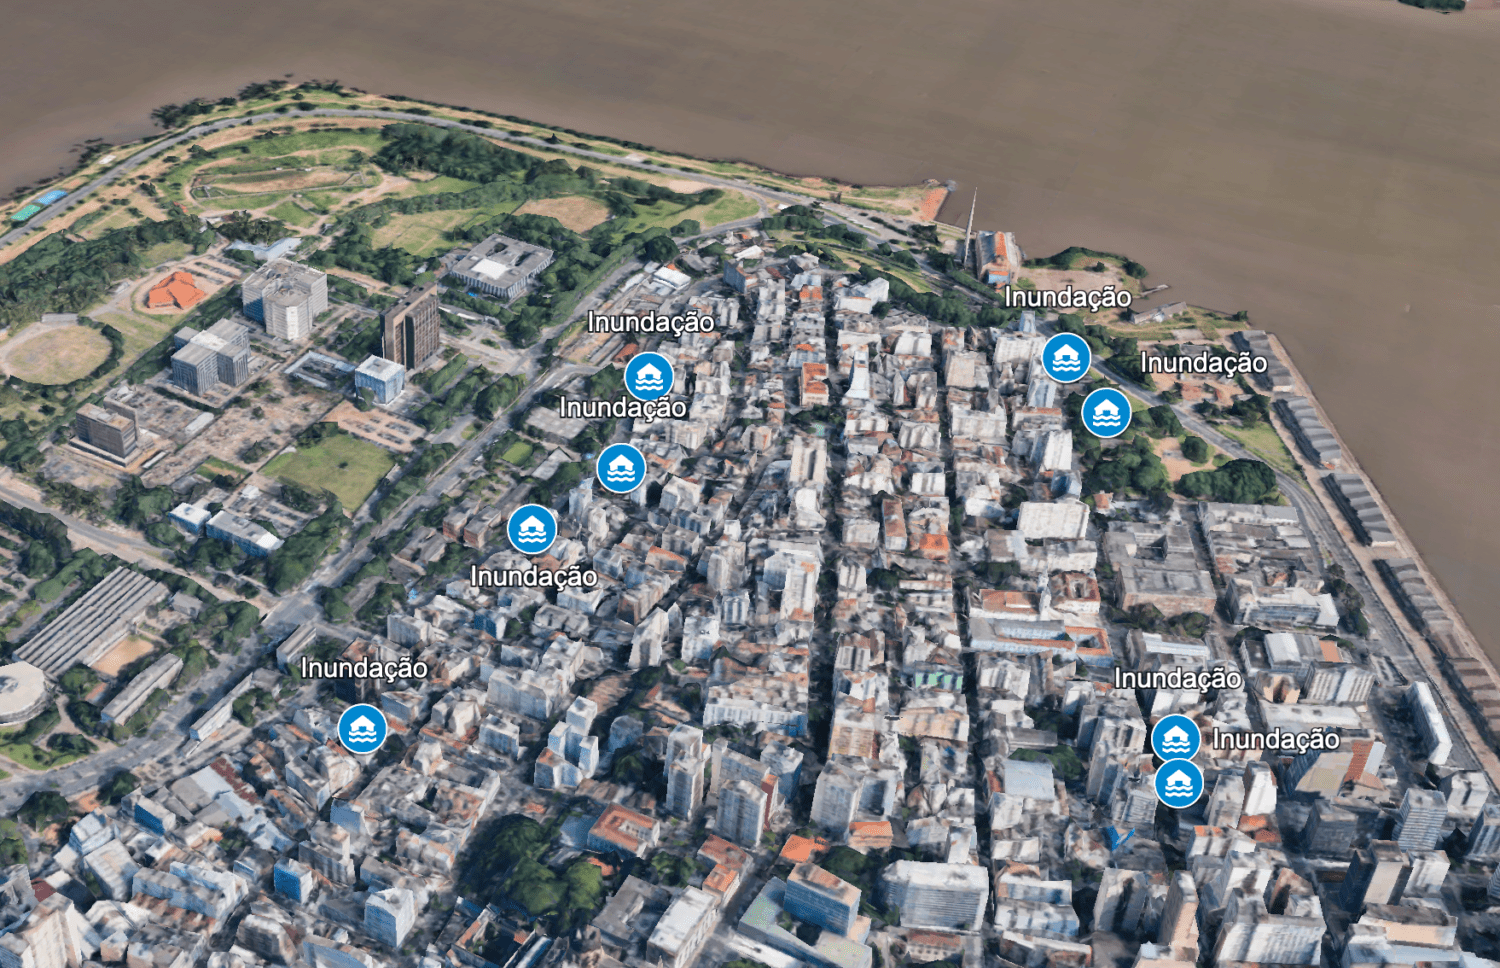
That’s when Moraes decided she could do something to help. She created what is known as a Burger card, using Google Maps as a platform for ordinary people using their smartphones to determine the floodwater’s reach. These so-called citizen scientists were instructed to take photos of what they saw and send them along with their geolocation to a WhatsApp group monitored by Moraes and her team. By combining that information with historical flood data from the area, the team can model what might happen during future floods, helping residents who have already lost everything decide where it would be safest to rebuild their lives. The models can also give authorities the information they need for better urban planning and allocation of resources.
Fascinated by the potential of the project, Wendt knew he wanted to get involved. By this time, Univates had collaborated with the Federal University of Rio Grande do Sul, and this time the goal was to map the entire state of Rio Grande do Sul.
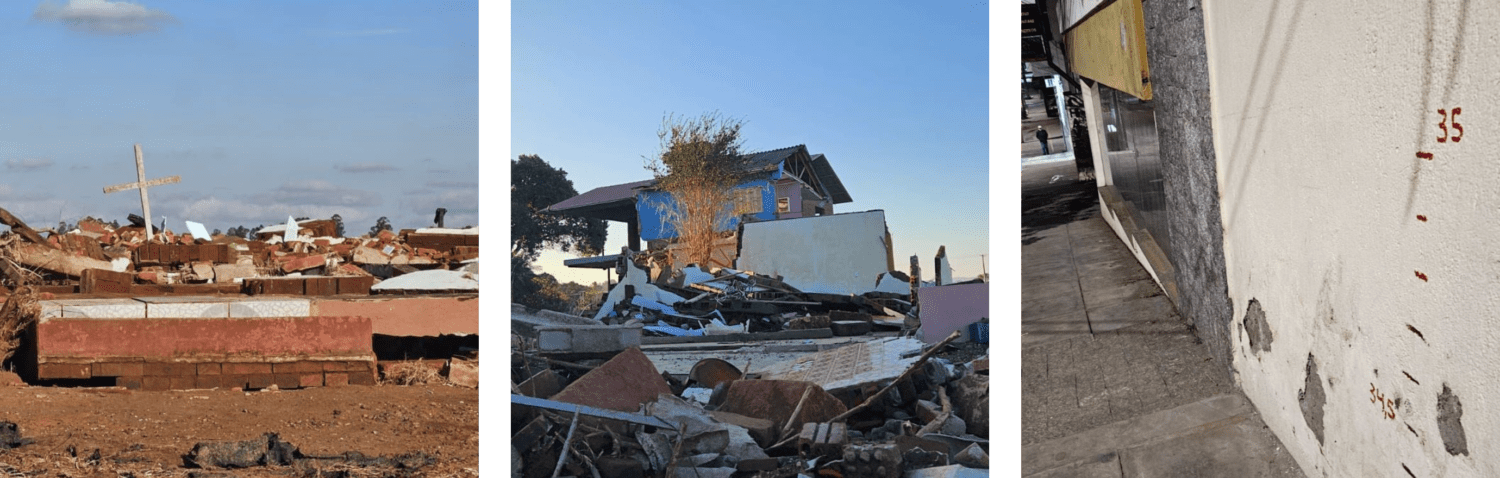
Driving around his hometown, Wendt took pictures of everything he thought would benefit the Citizen Map: a white cross smeared with mud where a church once stood; a lonely house standing among pieces of hundreds of others that washed away; marks on a wall in the city center that recorded the height of the water.
Wendt’s more than 20 data points collected at the end of May are now among the more than 600 on the constantly updated Citizen Map, a contribution he knew would help others, but which he was surprised to see also helped him.
“It helped me understand all these connections,” he said. “If it rains in one place, what is the impact downstream? Someone who participates in this type of citizen science initiative is ultimately more aware, safer and more empowered to deal with this type of situation, which we unfortunately know we can expect more of in the near future.”
In the context of climate change, the team behind the Citizen Map wants Brazilian authorities to use this data to rethink everything from city planning and post-disaster recovery to the availability of health care and clean drinking water in the wake of climate change-induced catastrophes. They also hope that by educating people about what’s going on around them, they will not only become more interested and invested in participating in solutions to local flooding, but will also feel prepared to face what’s to come.
Experts have attributed the severity of the recent flooding in southern Brazil to human-driven climate change. An analysis conducted by researchers at the Pierre Simon Laplace Institute’s Climate and Environmental Sciences Laboratory showed that extreme weather events in Rio Grande do Sul that occurred between 2001 and 2023 produced up to 15 percent more precipitation than events occurring between 1979 and 2001 took place.
A recent study also found that “the highly populated regions [in] South and Southeast Brazil as well as the coastal part of Northeast Brazil are most exposed to landslides and floods,” and that these impacts will continue to worsen with more warming. and increased the intensity of the rainfall between 6 and 9 percent.
The first record flood that washed out the Taquari Valley and other parts of Rio Grande do Sul occurred in 1941. That event, which also occurred in April and May, left the region’s population, who at the time lived mostly in rural areas, without food, water and shelter. The only record of the floodwater’s height was a mark scratched into the wall of a school.
“That memory is isolated there,” Wendt says of the marker. “It doesn’t contribute as much as it could if it happened these days with the technology we have.”
The first Citizen Map that Moraes created last September only collected data on the perimeter of the affected area to determine which parts of the Taquari Valley would be considered at high risk of future flooding. About 600 data points were submitted by 150 citizen scientists.
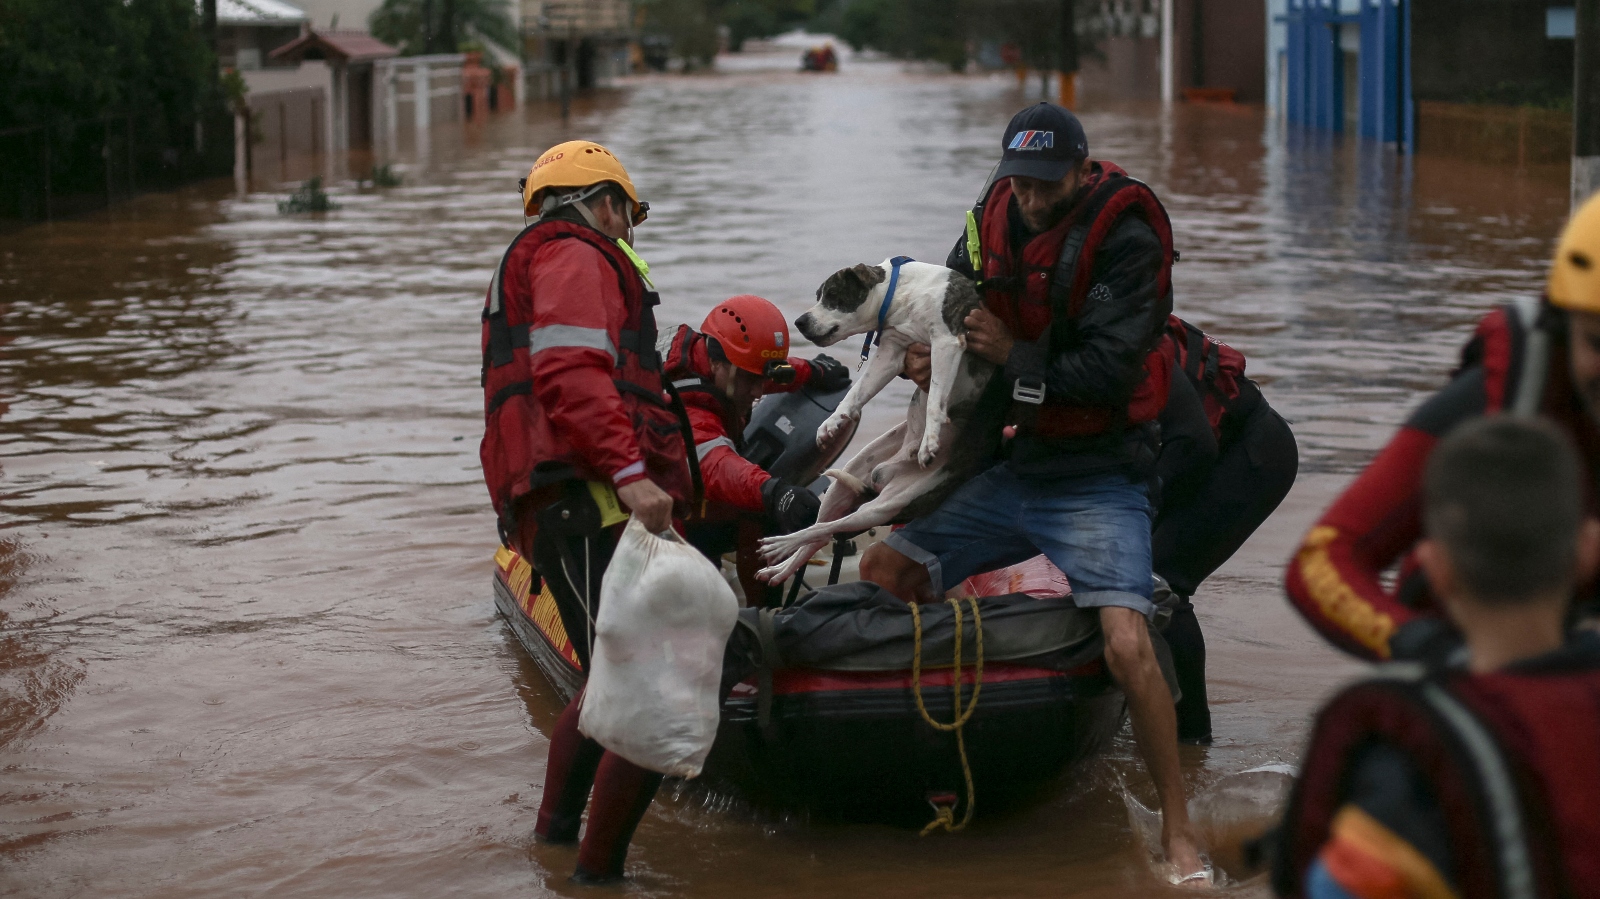
Some neighborhoods that participated heavily in the mapping of the September floods were not involved in the creation of the new map, but this is likely because those areas are still difficult to access, or not accessible at all. And as the state continues to recover from the emergency — it initially focused on rescuing people and animals from fast-moving waters and collapsing buildings and is now moving people into shelters and other more permanent housing — data is expected to -collection will be slow.
“Data will probably start coming in faster in another two or three weeks,” says Moraes. “The actual modeling of the Citizen Map should happen in July and August, and it will then also be available for consultation.”
In addition to using perimeter data, which shows the horizontal distribution of water, the new map will also use data related to the height of floodwaters, often measured by water and mud stains left on the walls of people’s homes and local businesses be left
The Citizen Map is currently very simple and powered by Google, but the team plans to collaborate with the open-mapping nonprofit Humanitarian OpenStreetMap Team to improve the visuals of their final product. “Google Maps has good visuals, but they’re pretty standard,” says Wendt. “We want our map to be as easy to understand as possible to make sure it can be used by anyone who wants to consult it to keep themselves safe and make the best decisions possible for their future.”
On May 2, when the second of this year’s three rain and flood episodes began in Rio Grande do Sul (the other two were on April 29 and May 13), Moraes and her team had to move out of the university building where they were working. The water began to rise again, and this time it came inside.
They ended up setting up shop at A Hora, a local radio station that gave them space to work and talk about their project on air, providing his WhatsApp number for anyone who wanted to send data or ask questions.
Before long, messages started pouring in. About 200 people sent their locations to the Citizen Map team on May 2, and the team spent the afternoon and night gathering data to determine who was in or near a risk area and who should evacuate. For people living downstream, information about what happened further upstream was crucial to making such decisions.
“It is so important for people to understand their surroundings, to know if they are in a risk area,” says Moraes. “And they want to understand. They want to be engaged.”
While anyone with a smartphone can collect data for the latest edition of the Citizen Map, most participants so far are professors and their students from universities across the region. The hope is that more people will join once the situation on the ground starts to improve.
“I really support citizen science initiatives because that’s exactly what people need to learn and feel empowered,” says Marta Angela Marcondes, an expert in water resources and coordinator of the Water Pollution Index Project at the Municipal University of São Caetano do Sul. “I really believe in processes of prevention and not remediation, and civil society is a key component in making that happen.”
The culture of prevention is also important to Moraes. She wants the Citizen Map to not only help residents of Rio Grande do Sul keep themselves safe and informed, but also that it will guide authorities to do the same. By using the map to define risk areas, she says, decision-makers can improve urban planning, create better mitigation plans for future flooding — such as improving stormwater drainage and management systems — and allow new homes, schools and health care facilities, among other things. , to be built in safer areas.
Moraes wants the Citizen Map to continue to grow and eventually map the lack of drinking water and access to basic healthcare, as well as cases of disease, in the wake of climate-related crises.
“With that information, I can see the big picture by municipality, region or state,” she says. “As a decision maker, I can then use this information to determine which areas are more fragile and direct the necessary public policies to those who need them most.”
Two to five years after the original event, Moraes hopes she will be able to map where those public policies have landed and measure their success. “In this new context of climate change, people need to be prepared,” she says. “We can’t stop these events from happening, but we can make sure we’re ready to deal with them in the best way possible.”