When Cleophus Sharp was four years old, his parents rushed him to the hospital in Houston because he couldn’t catch his breath no matter how hard he tried. Sharp, who grew up in the historically Black neighborhood of Pleasantville in Houston, Texas, says he almost died because the air in his community was toxic. Sharp spent two weeks in an oxygen tent before returning home.
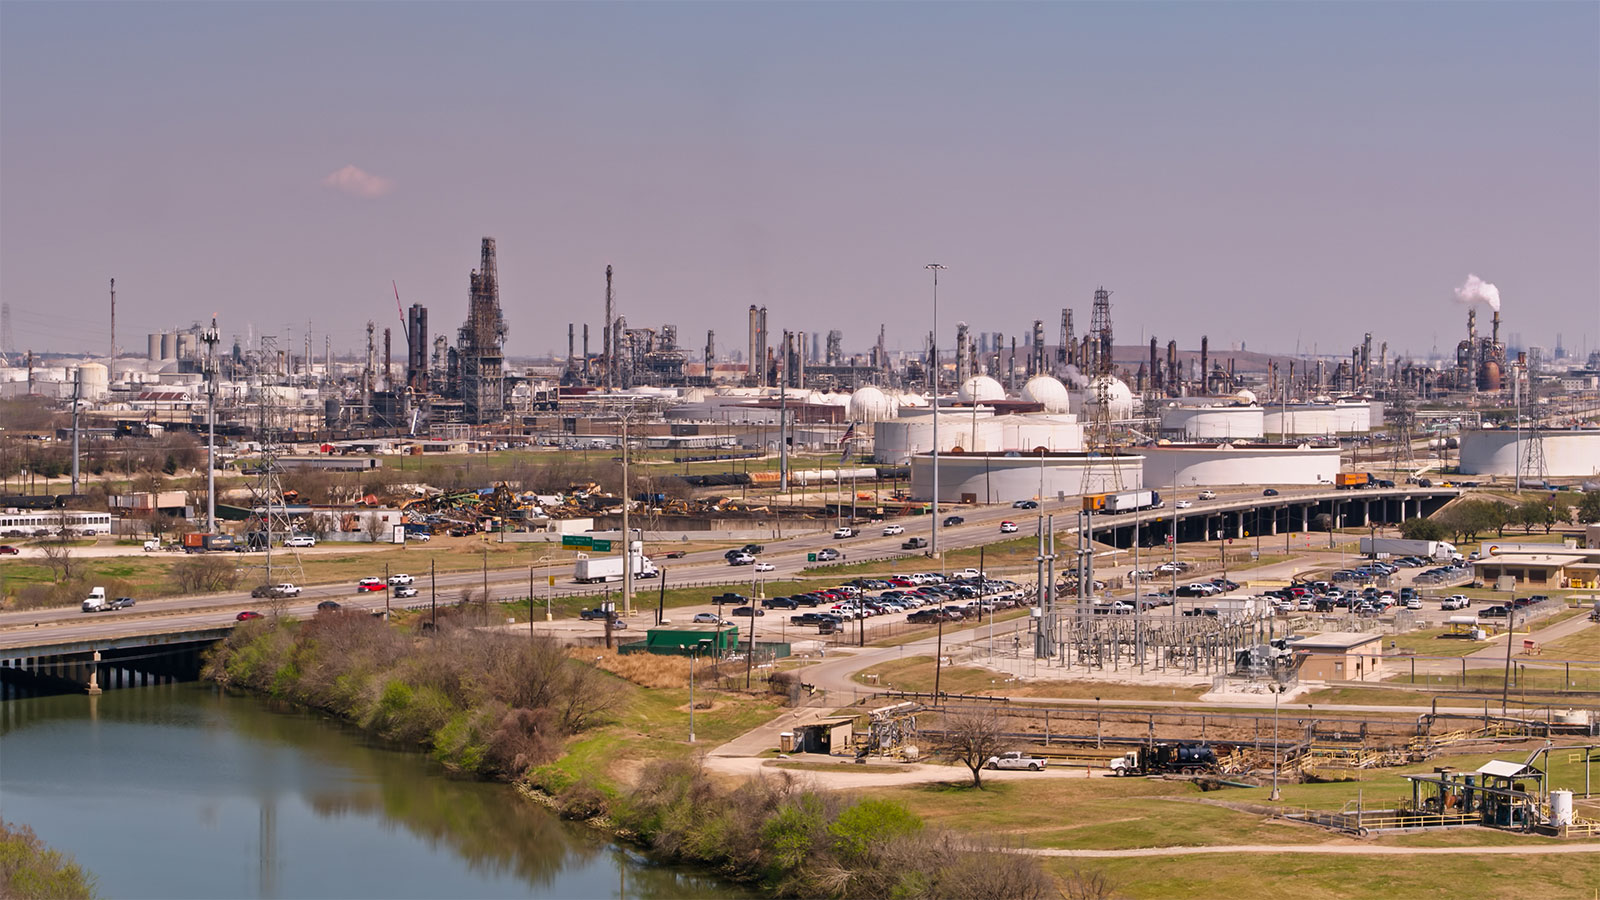
Through his organizing work, Sharp later learned that air pollution in his neighborhood likely led to his developing asthma. Pleasantville is traversed by several major highways, and near an international shipping link adjacent to regular truck traffic. “Those industries that were polluted [were] just three miles from us,” Sharp said.
Hemmed in by two major freeways, saddled with industrial chemical manufacturing plants and recycling centers, and located next to two major trade terminals, Pleasantville is in the 99th percentile for national climate vulnerability, according to the US Climate Vulnerability Index, a tool developed by the nonprofit Environmental Defense Fund in partnership with Texas A&M University and a range of community groups such as Achieving Community Tasks Successfully, the nonprofit where Sharp serves as a board member. The Climate Vulnerability Index is a first-of-its-kind mapping tool that allows users to explore social, environmental, economic and health conditions from every census tract in the US
Sharp’s health concerns are shared by many. For decades, residents of Pleasantville have been forced to contend with polluted air and soil, disinvestment in public programs and services, and a lack of empirical data to demonstrate what residents know to be true: Pleasantville’s environmental conditions have made too many of them sick. .
“Part of the problem is that a nonprofit has never before had access to these kinds of resources to prove that point,” Sharp said. “We can just tell you, ‘so many people have died from this, and so many people have this problem.'” He says the mapping index will make a “huge difference” to communities like Pleasantville across the country, and they will help to the source of pollutants and help demonstrate to zoning boards and permitting agencies why additional pollution should not be permitted in already congested locations.
Grace Tee Lewis, a senior health scientist at the Environmental Defense Fund who championed the idea of the mapping tool, said the index could help community advocates like Sharp demonstrate to elected officials and public agencies the connections between inherent threats, such as weather, and vulnerabilities. illustrated by social and economic policy over time.
“I think that some of these intersections — where climate, environment and existing inequalities have systematically disenfranchised communities — really need to be at the forefront of the policy that we prioritize to try to break the cycle of disadvantage,” Tee Lewis said.
The inspiration for the index came from other tools that compile environmental and climate data by neighborhood, such as the Environmental Protection Agency’s Environmental justice screening and mapping tool or CalEnviroScreen, California Communities Environmental Health Screening Tool, says Tee Lewis. But few tools take such a comprehensive approach as the new index, which accounts for elements of public funding and policy that impact how much a community could be affected by a disaster – and how hard it will be for them to restore. For example, no other tool incorporates environmental data with data from the legacy of racist policies, such as the intentional segregation of redlining. Without this kind of data, Tee Lewis worried that people were missing out on funding or interventions that actually fit their needs. Because one of the project’s central goals was to support the work of community organizations, Tee Lewis and her team found it essential to work with under-resourced places to learn what environmental or social factors should be included.
Tee Lewis reached out to community leaders like Sharp, who sits on the board of a Pleasantville-based community empowerment organization called Achieving Community Tasks Successfully (ACTS). Feedback from ACTS and other grassroots organizations helped Tee Lewis and the other researchers understand that it was critical to include not only existing sources of pollution, but also what day-to-day factors may contribute to environmental vulnerability, Tee Lewis said. said. For example, the index tracks the percentage of people living with chronic diseases, who may be particularly susceptible to climate and pollution impacts.
These conversations expanded what the index would later define as ‘vulnerability’ to include measures of public transport availability and access, the percentage of children taking medication to treat cognitive behavioral differences, rates of homelessness, or even the number of religious and civic organizations within a community.
After including these factors in their scoring methodology, researchers found that communities with the highest scores are those with “longstanding concerns about environmental justice and health disparities, [and] communities that have had a history of inequality,” Tee Lewis said.
By varying or placing different vulnerability factors on the map, such as chronic disease and housing vulnerability, users may be able to tell a story through the data that can help illustrate how these historical harms have systemic present-day impacts. For example, redlining, the practice of discriminatory mortgage lending policies introduced in the mid-20th century, is closely related to the climate impacts that communities face today, says Tee Lewis.
Sharp’s childhood home in Pleasantville was, for example one of the only neighborhoods where Black Houstonians could buy houses with cement foundations in the 1940s. His family moved there partly because they could live safely. “They were able to live a comfortable life, and the people came together to build a close-knit neighborhood [where] people looked out for each other,” Sharp said.
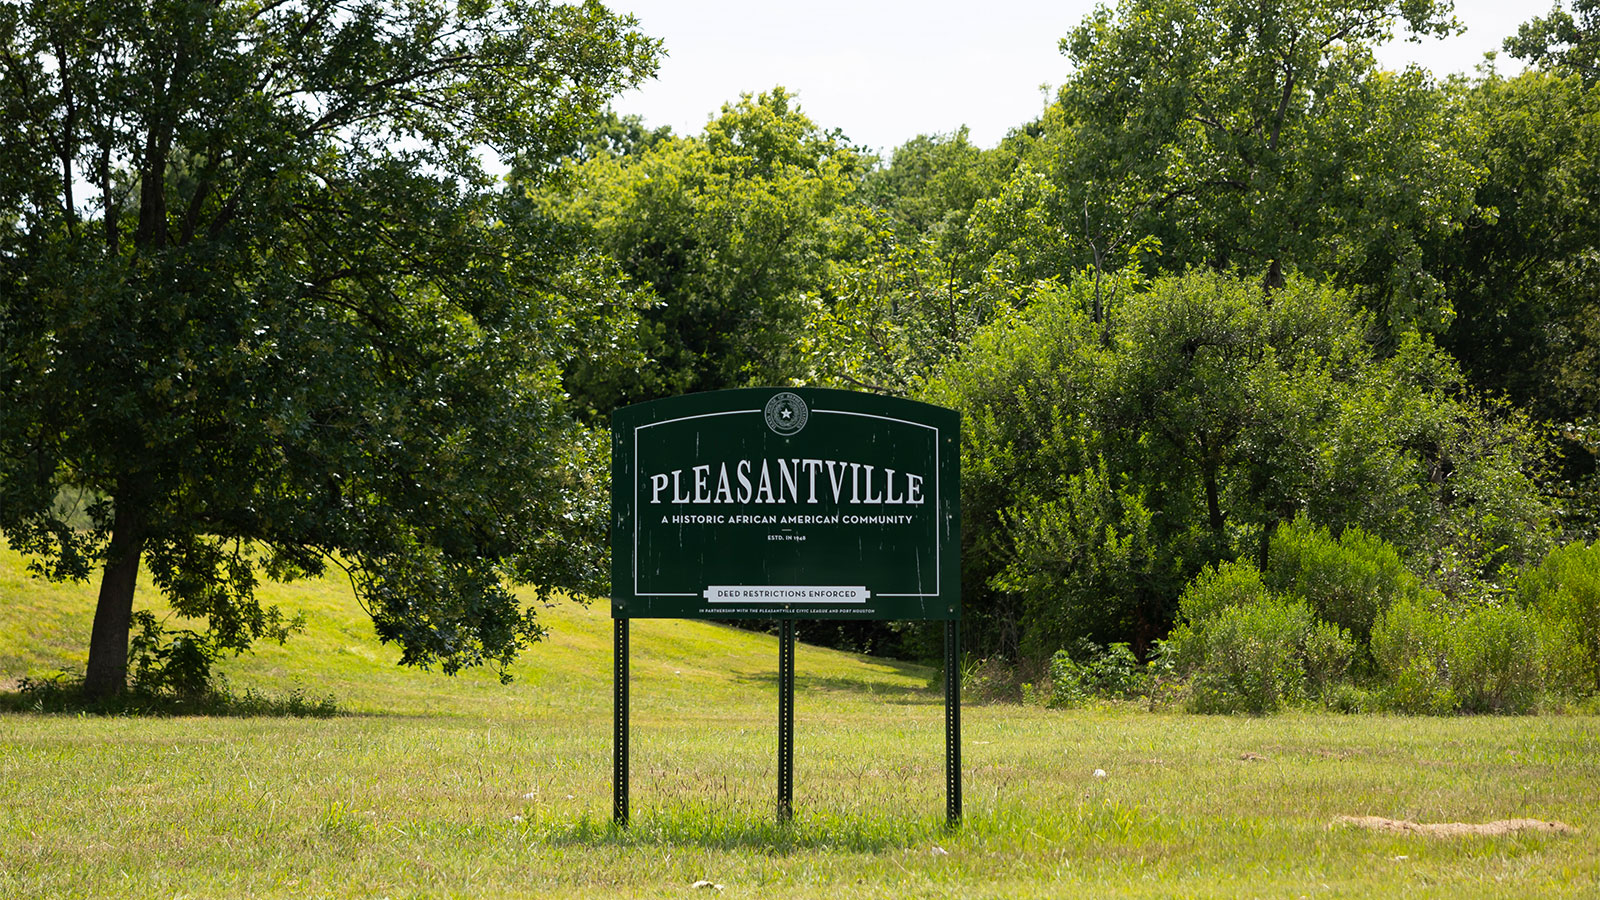
But racist zoning and policy decisions threatened the budding community. A “Welcome to Pleasantville” sign once stood atop the Ship Canal’s dredged waste. In 1957, the area flooded, sending toxic sludge over 40 blocks and displacing the sign. Two major highways built in 1958 and 1974 added significant air pollution. In 1995, a chemical warehouse owned by Houston Distribution Inc. set on fire three times. Legislators recently decision to widen and deepen the Houston Ship Channel. Some local residents are fighting the decision, as it would require the Army Corps of Engineers to excavate potentially toxic bayou sediment that would then be placed in containment zones located almost exclusively in environmental justice communities, such as Pleasantville. If this project is approved, the existing dredge pile will double in size.
For too long, it has been difficult for decision-makers to see information about how environmental injustice, racial discrimination and climate change are interconnected, says risk analyst Weihsueh Chiu, a professor at Texas A&M University who worked with Tee Lewis to create the index. .
The index can help draw attention to climate risks that might otherwise have gone under the radar, such as English fluency, as the Federal Emergency Management Agency notoriously underprepared to assist Spanish-speaking survivors of environmental disasters. “This tool allows you to zoom in and zoom out,” Chiu said. Some places, like Vermont, for example, may initially have fewer risks, but the tool can help draw attention to clusters of chronic diseases amid an otherwise healthy — or at least perceived — condition.
Chiu hopes this is just the first step, and in the future the team plans to continue adding to the conditions users can explore, such as proximity to warehouses. There is no national inventory of warehouse locations, and Chiu relied on Google Earth imagery to locate warehouses in individual communities, such as Will County, Illinois, where warehouses are mushrooming due to their location at the intersection of two major highways which is used for shipping. In some cases, volunteers drove to some of these sites to confirm that the warehouses did exist.
Going forward, the team will continue to add to and modify the tool as needed. But already the index has the opportunity to narrow the gap between the lived experiences of community members and environmental policy enacted in the legislature. “It was the legwork that we tried to do as a service to communities, especially disadvantaged communities,” Chiu said.
In another way, Sharp hopes the index will serve as a mirror to residents affected by pollution, so they don’t get caught up in thinking health issues are inevitable. “People have lupus, they have upper respiratory problems, and they just think that people dying of cancer are normal. They don’t realize that the cancers are coming from some of the stuff in the air that they’ve been breathing for years.”
One of the world’s leading international nonprofit organizations, Environmental Defense Fund (EDF) creates transformational solutions to the most serious environmental problems. To do this, EDF connects science, economics, law and innovative private sector partnerships. With more than 3 million members and offices in the United States, China, Mexico, Indonesia and the European Union, EDF’s scientists, economists, lawyers and policy experts work in 28 countries to turn solutions into action.
Grist’s editors have the Climate Vulnerability Index before. This article is sponsored content from EDF and is not linked to Grist’s previous coverage. Sponsors play no role in Grist’s editorial coverage.